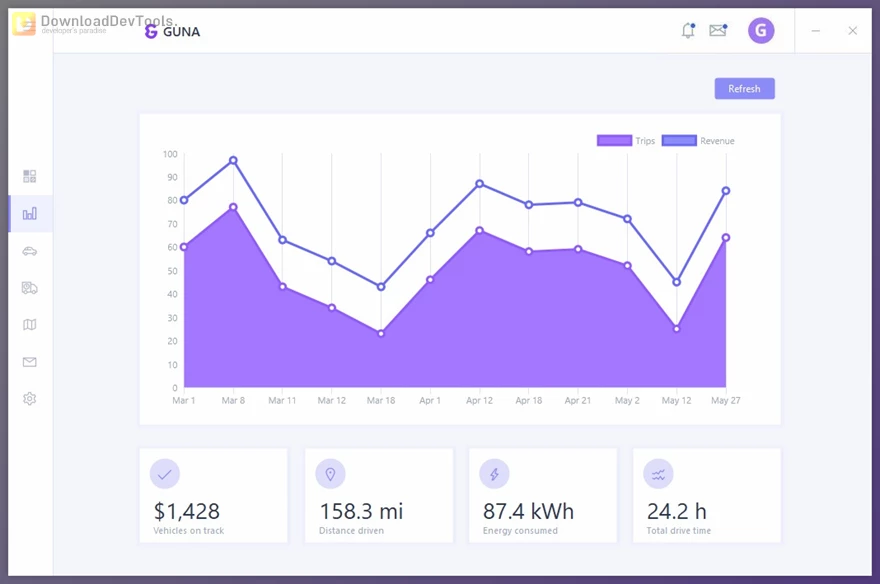
The Guna Charts for Winforms constitute a contemporary visual library that transforms your data into informative and interactive data displays. Guna Charts provides an intuitive platform to design visually stunning charts that require minimal learning effort for any developer working on dashboards, reports, or data visualization applications. You can use 16 standard charts, such as bars, lines, pies, and areas, to create presentations that match your data needs.
The library's user interface design functions at different screen sizes, enabling charts to display optimally. The system enables live updating, thus displaying real-time changes in data. The same graph can contain a combination of different chart types, including line charts and bar charts. Guna Charts for Winforms stands out for developers needing robust charting features that offer instant use and a contemporary GUI.
Key Features of Guna Charts for Winforms :
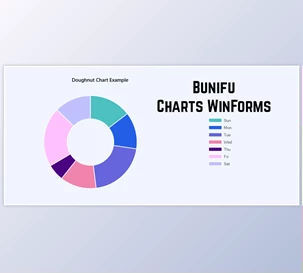
- 16 Chart Types – Includes Area, Bar, Line, Pie, Doughnut, Scatter, Radar, and more, so you can choose the best visual for your data.
- Responsive Design – Charts automatically adjust to different window sizes or resolutions, ensuring a smooth user experience.
- Live Charts – Easily display real-time data that updates instantly without needing to refresh the chart manually.
- Mixed Chart Types – Combine different chart styles in one view (e.g., bar and line together) to compare multiple data sets effectively.
- WinForms Integration – Built specifically for Windows Forms apps, making it easy to plug in and use with your existing projects.
- User-Friendly API – Simple and intuitive functions to build charts quickly without needing deep technical knowledge.
Click on the links below to Download the latest version of Guna Charts for Winforms with CRACK!

رمز فایل ها : DownloadDevTools.ir
Note
Download speed is limited, for download with higher speed (2X) please register on the site and for download with MAXIMUM speed please join to our VIP plans.
Discover free tools, limited-time offers, and stay updated with the latest software we release.


![FREE Download DevExpress Universal Complete [.Net Components] v26.1.3.26179 (18 Jun 2026) + Documentation + Patcher](https://downloaddevtools.com/filemanagercontent/files/1/prolistnormal/124-banner.png)