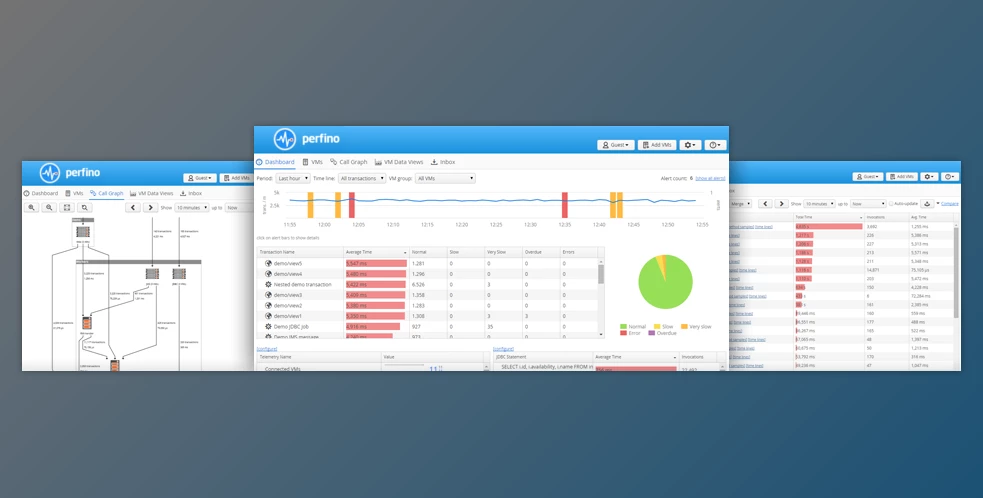
EJ Technologies Perfino is a powerful JVM monitoring tool designed for production environments that offers detailed insights with minimal overhead. It’s particularly suited for systems with microservices, as it provides a single, flexible license that covers unlimited JVMs and transactions. This means you can easily scale your monitoring as your system grows without worrying about additional costs. The tool’s user-friendly dashboard gives a quick snapshot of your system’s health, allowing you to see at a glance whether everything is running smoothly or if there’s a problem.
EJ Technologies Perfino excels at monitoring complex operations that span multiple VMs, such as business transactions involving different layers of your application. It connects these transactions into a clear call graph, making it easy to understand both current and past operations. You can set up automated alerts and triggers for critical issues, like slow transactions, ensuring you can respond proactively when problems arise. Whether you need to capture thread dumps, send notifications, or delve deeper into performance data, Perfino makes configuration simple.
In addition to its real-time monitoring features, EJ Technologies Perfino also provides robust historical analysis tools. You can compare performance data from different points in time to identify trends and measure the impact of updates. The tool also integrates seamlessly with profilers like JProfiler for more in-depth analysis when needed. Overall, Perfino offers a comprehensive solution for monitoring JVMs in a production environment, focusing on ease of use, scalability, and deep performance insights.
Key Features of EJ Technologies Perfino :
- Scalable Licensing for Microservices: One license covers unlimited JVMs and transactions, ideal for large systems and microservice architectures.
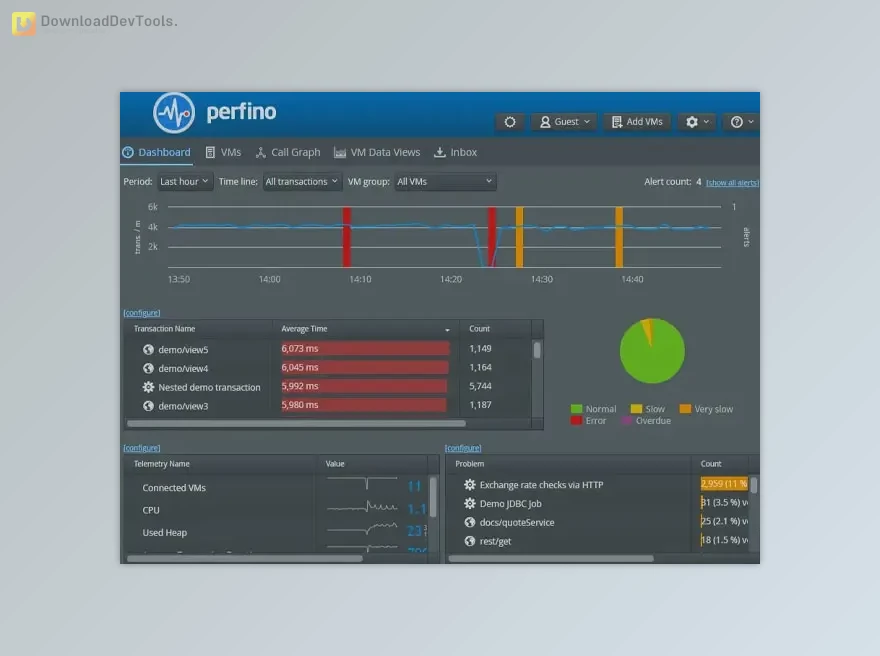
- Real-Time System Health Dashboard: A user-friendly dashboard that instantly shows whether your system is running smoothly or experiencing issues.
- Cross-VM Transaction Monitoring: This tool tracks business transactions across multiple VMs, providing a clear call graph of operations both now and in the past.
- Proactive Alerts and Triggers: Easily set up alerts and automated responses for performance issues, such as capturing thread dumps or sending notifications.
- Detailed Telemetry and Trend Analysis: Capture and visualize scalar metrics like database operations, with data preserved over time for in-depth trend analysis.
- Flexible Business Transaction Configuration: Automatically detect or manually define business transactions based on method calls, annotations, or API usage.
- Comprehensive Call Tree Analysis: Organize transactions into a detailed call tree, highlighting slow or problematic transactions for focused investigation.
- Database Performance Insights: Monitor and analyze the performance of database operations, identifying slow queries and their associated business transactions.
- Method-Level Sampling: The periodic sample method calls to identify performance hotspots within transactions, especially when diagnosing slow operations.
- Historical Performance Comparisons: Compare performance data across different periods to measure the impact of updates and detect long-term trends.
- Seamless Integration with Profilers: Includes native JVMTI sampling and the ability to prepare VMs for JProfiler connections when deeper analysis is needed.
Click on the links below to Download the latest version of EJ Technologies Perfino with Keygen!
 EJ Technologies Perfino v4.3 (03 Mar 2026) for Win x64 + Keygen.rar (Size: 141.2 MB - Date: 4/20/2026 11:45:10 AM)
- EJ Technologies Perfino v4.3 (03 Mar 2026) for macOS + Keygen.rar (Size: 156.2 MB - Date: 4/20/2026 11:45:08 AM)
- EJ Technologies Perfino v4.2.0 (07 Apr 2025) for Win x64 + Keygen.rar (Size: 139.5 MB - Date: 11/26/2025 8:17:05 AM)
- EJ Technologies Perfino v4.1.0 (21 Sep 2023) for Win x64 + Keygen.rar (Size: 107.8 MB - Date: 11/26/2025 8:17:03 AM)
Files Password : DownloadDevTools.ir
Note
Download speed is limited, for download with higher speed (2X) please register on the site and for download with MAXIMUM speed please join to our VIP plans.
Discover free tools, limited-time offers, and stay updated with the latest software we release.