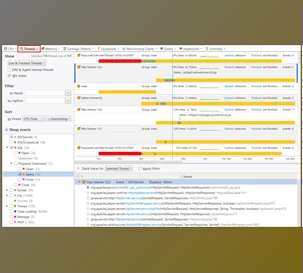
EJ Technologies JProfiler is a top-tier Java profiling tool designed to help developers easily identify and resolve performance issues, memory leaks, and threading problems. It offers deep insights into all aspects of Java applications, making it a go-to solution for both development and production environments. Whether you need to optimize database calls, analyze HTTP performance, or manage complex threading, JProfiler provides the tools to pinpoint issues and boost application efficiency quickly.
One of EJ Technologies JProfiler’s standout features is its seamless support for modern environments like Kubernetes, Docker, and remote JVMs. Profiling in these setups is often complicated, but JProfiler simplifies the process with straightforward UI options and zero-configuration remote profiling. JProfiler integrates directly into popular IDEs like IntelliJ IDEA, Eclipse, and NetBeans, enabling developers to start profiling sessions with a single click.
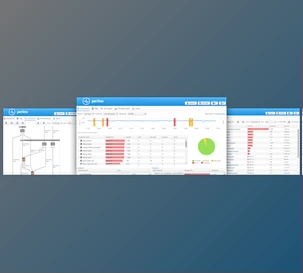
EJ Technologies JProfiler also offers specialized tools for monitoring various technologies and frameworks, such as Spring, JEE, MongoDB, and more. It provides real-time data visualization and offline analysis options, allowing users to save and compare snapshots, analyze memory usage, and track request flows across multiple JVMs. With these comprehensive features, JProfiler helps developers save time, reduce cloud costs, and minimize production outages.
Key Features of EJ Technologies JProfiler :
- Comprehensive Database Profiling: Offers deep insights into JDBC and JPA performance issues for faster resolution.
- Kubernetes and Docker Support: Makes it easy to profile JVMs in containerized environments with intuitive UI selections.
- Zero-Configuration Remote Profiling: Profile remote JVMs using only SSH credentials without needing remote installation.
- Advanced HTTP Call Analysis: Tracks incoming and outgoing HTTP calls across multiple JVMs for thorough performance assessment.
- Spring and JEE Integration: Combines high-level framework insights with detailed method call analysis.
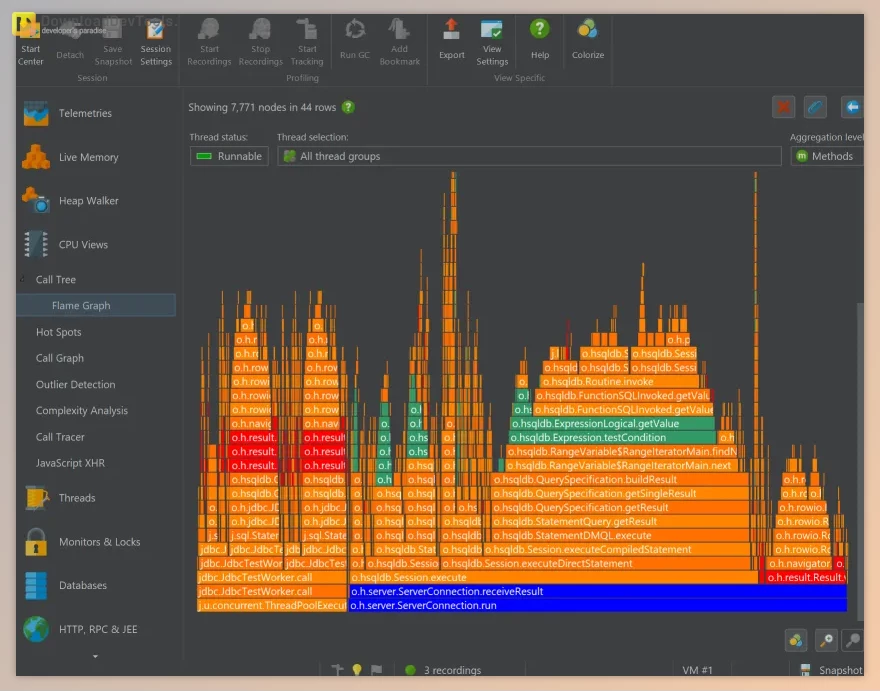
- Live Data Profiling: Displays real-time profiling data during sessions for immediate feedback.
- IDE Integration: Plugins for IntelliJ IDEA, Eclipse, and NetBeans enable one-click profiling directly from your code.
- Application Server Wizards: Simplifies the setup for profiling on popular servers by auto-configuring scripts and settings.
- Memory Leak Detection with Heap Walker: A powerful tool to analyze memory usage and find leaks efficiently.
- Snapshot Comparison and Offline Profiling: Save, compare, and analyze performance snapshots over time, with or without a UI.
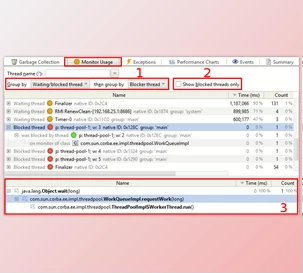
- Request Tracking Across JVMs: This feature tracks call chains across threads and JVMs, with support for HTTP, gRPC, RMI, and more.
- Custom Probe Creation: Create custom probes using scripts or APIs for targeted performance monitoring.
Click on the links below to Download the latest version of EJ Technologies JProfiler with Keygen!
- OLD (0 B - 6/27/2026 12:47:27 PM)
 EJ Technologies JProfiler v16.1.1 (17 Jun 2026) for Win + Keygen.rar (Size: 184.0 MB - Date: 6/27/2026 12:45:59 PM)
- EJ Technologies JProfiler v16.1 (09 Apr 2026) for macOS + Keygen.rar (Size: 208.0 MB - Date: 4/16/2026 1:20:27 PM)
- EJ Technologies JProfiler v15.0.3 (20 Aug 2025) for Linux + Keygen.rar (Size: 186.1 MB - Date: 11/25/2025 11:16:52 PM)
Files Password : DownloadDevTools.ir
Note
Download speed is limited, for download with higher speed (2X) please register on the site and for download with MAXIMUM speed please join to our VIP plans.
Discover free tools, limited-time offers, and stay updated with the latest software we release.